

Brag Score : Measuring The Pomposity of YouTube Call-To-Actions
Brag Score : Measuring The Pomposity of YouTube Call-To-Actions
Brag Score: Framework to quantify trade-offs against some metric that is sure to go up
One of the most repeated conversations I was part of and contemplated during my last few months while re-designing key workflows of a product where something like this:
Designer: I've hidden this action behind a secondary menu.
PM: Mmm, that will affect our metrics negatively. Don’t think it is a good idea.
We intuitively agreed to challenges and decided to explore and understand a few widely used consumer and SaaS products (YouTube, Netflix, Instagram, Jira, Slack, Excel) to remove this ambiguity by quantifying the decision and trade-offs.
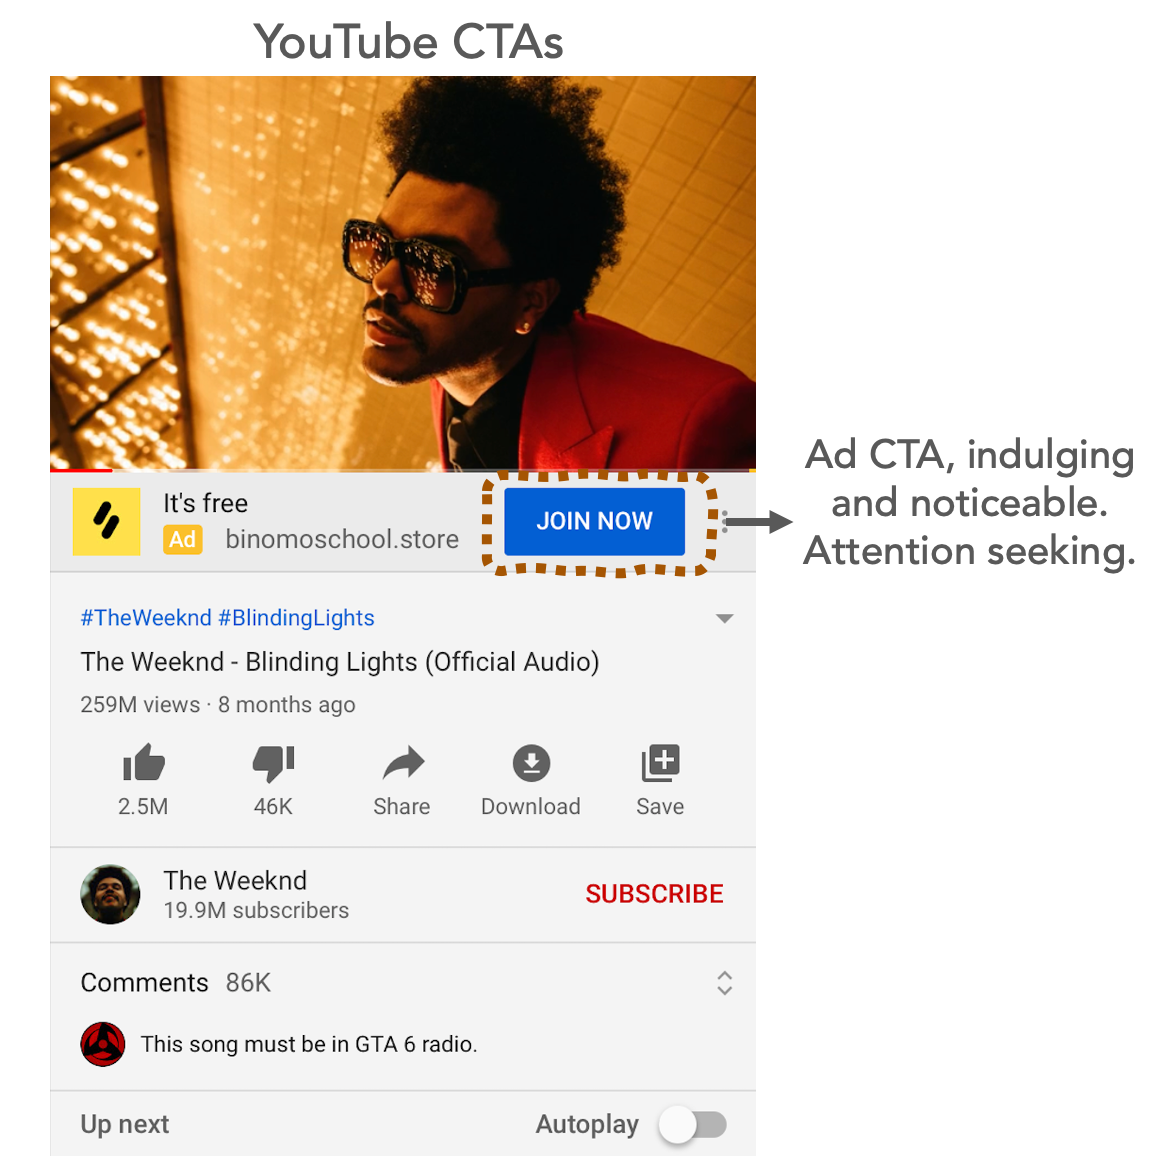
YouTube stood out and we discussed a bit around it, my colleague cheekily said: 'YouTube is pompous with many call-to-actions.' It felt as if discussions happen something like this at YouTube.
👩💼: We need more users to engage, like, share and subscribe to content.
🧑💼: Okay. Let's add more call-to-actions and make them more prominent.
At a glance, YouTube was over-whelming with two takeaways:
Call-to-actions (CTAs) organised feature-based, it perhaps is intuitive and default design philosophy. Organisation of actions (CTAs) is the gestalt principles at work, “identifying related items with a common region.”

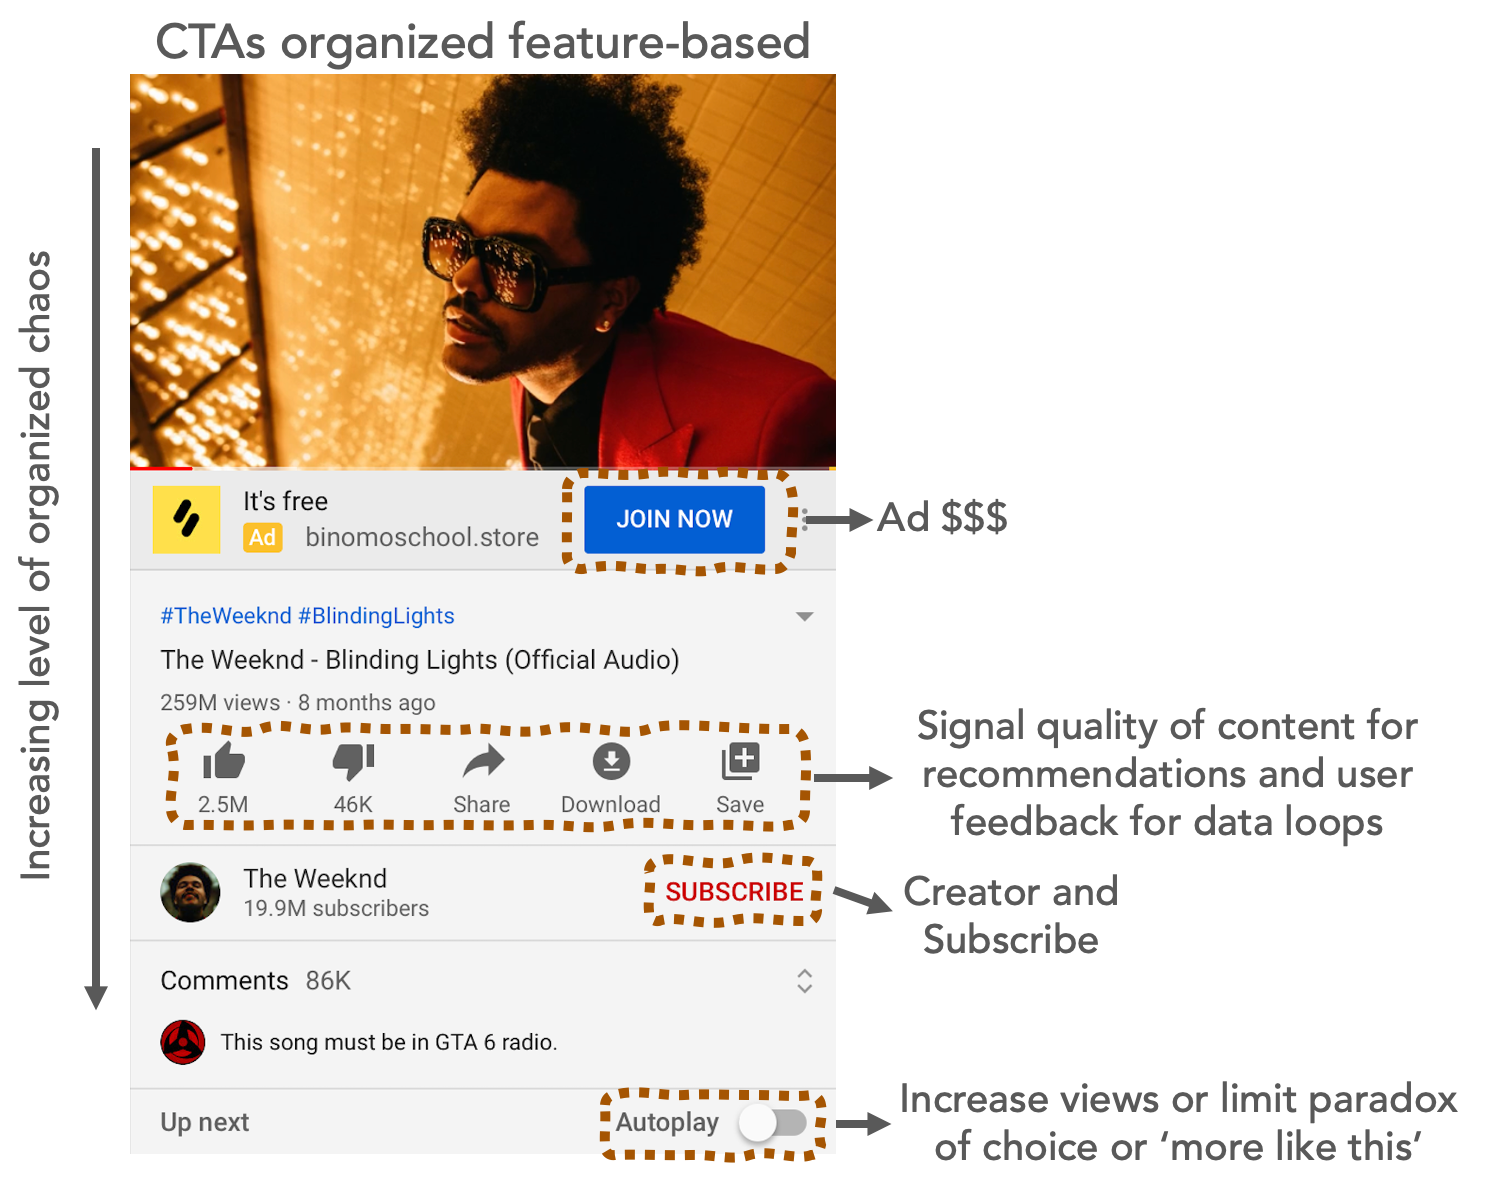
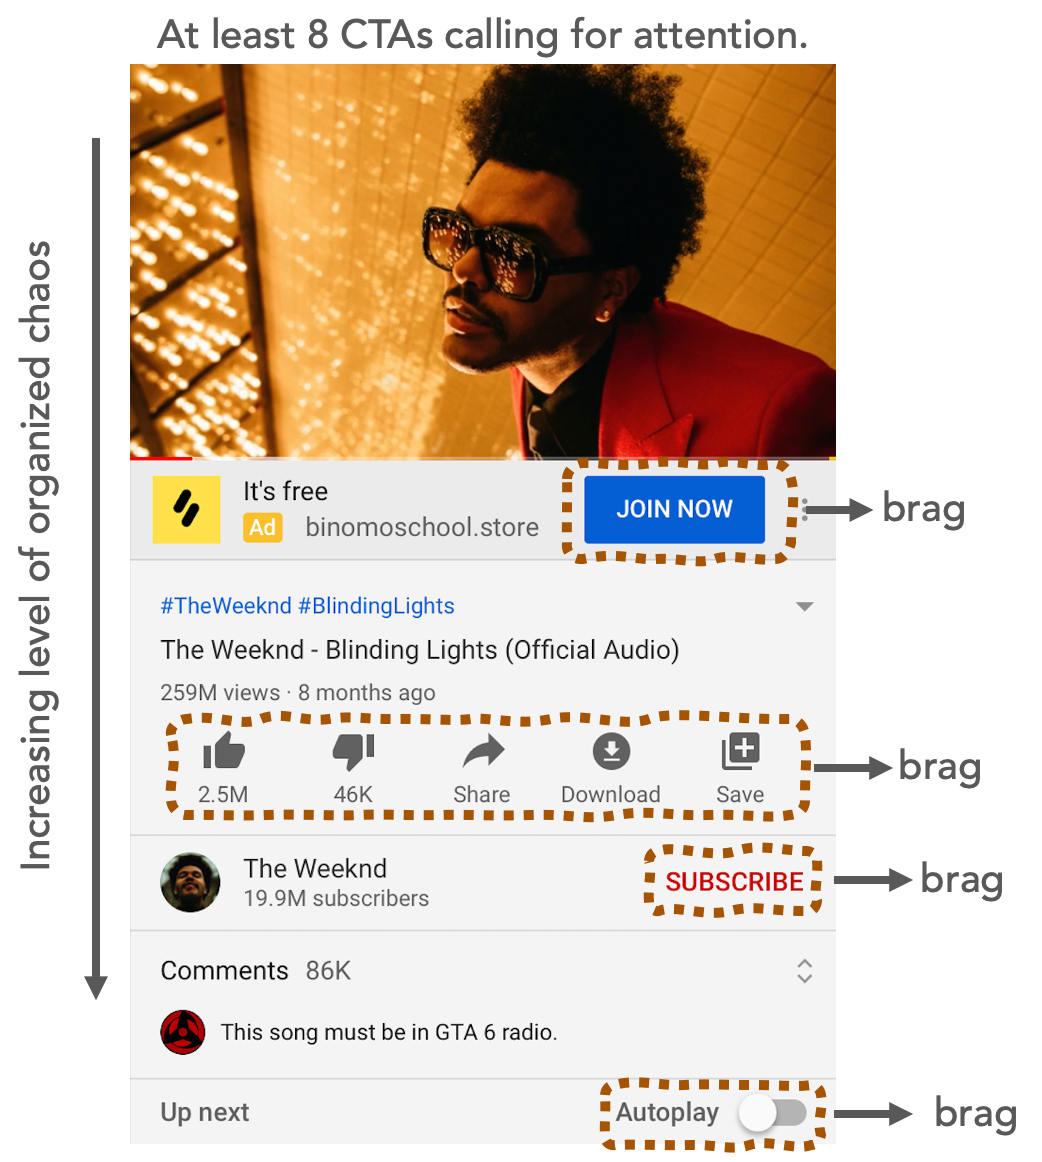
Each CTA brags over the other.
We were on YouTube’s free ad-supported version, but there is a paid version of YouTube that is less braggy around Ads. Led us to the reason that YouTube’s free version is optimising for a few key metrics with CTAs bragging as a trade-off.
Asserting something to users can be helpful, especially if users aren’t aware of it. But, it becomes annoying when assert becomes a constant brag. But, can we quantify ‘annoyingness’ of CTA to make the appropriate trade-offs against some metric that is sure to go up when we brag more?
1️⃣ Look at the conversion rate on the call-to-action (CTA)
Conversion Rate = [how many times users perform a particular action] / [how many times users see the CTA]
Very low conversion signals that we’re asserting something that's not very relevant to users.
Of course, what's considered "good" varies with what the action is and what the product comparables are.
Just looking at the conversion rate is inconclusive to quantify annoyingness of CTA.
2️⃣ Look at the number of users who get little or no benefit from the CTA
Pure conversion rate doesn't give us a sense of how many people are impacted. If an action's conversion rate is 1/10, that could mean:
10 people saw it and 1 person took the action
100,000 people saw it and 10,000 took action
Each of the above gives us a different story. So, conversion rate ratio doesn’t tangibly convey how many users have little or no benefit from the CTA. Conversion rate along with the number of users is also inconclusive to quantify annoyingness of CTA.
3️⃣ Let’s calculate the Brag Score for YouTube CTAs
Brag Score is an attempt to quantify this annoyingness.
Brag Score = [% of screen real estate utilised by CTA X 100] X [Attention Multiplier]
The lower the Brag Score, the better.
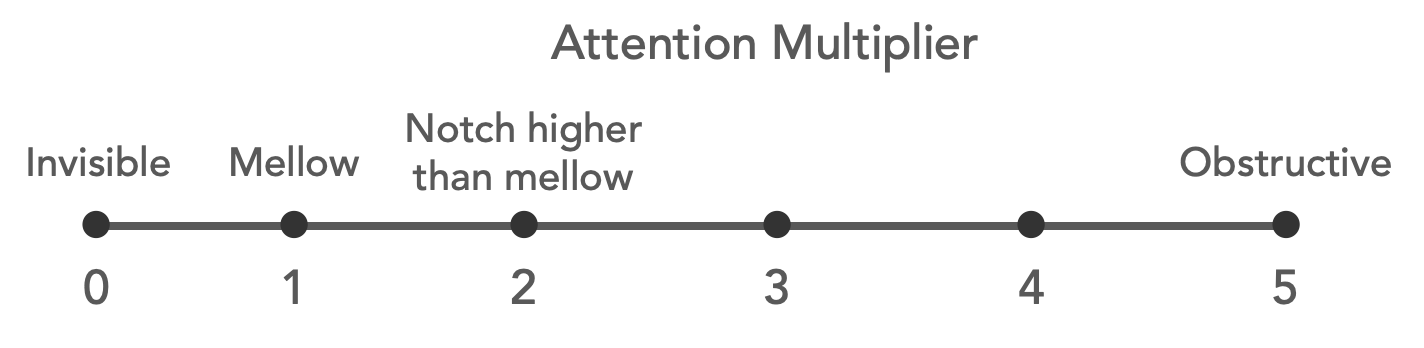
Attention Multiplier is a rating between 0 and 5, where:
0: CTA is invisible
1: CTA is of mellowed prominence compared to what users see and expect
5: CTA is obstructive that restricts a workflow and we can't get out of.
Other points on the scale can be defined based on the extremities
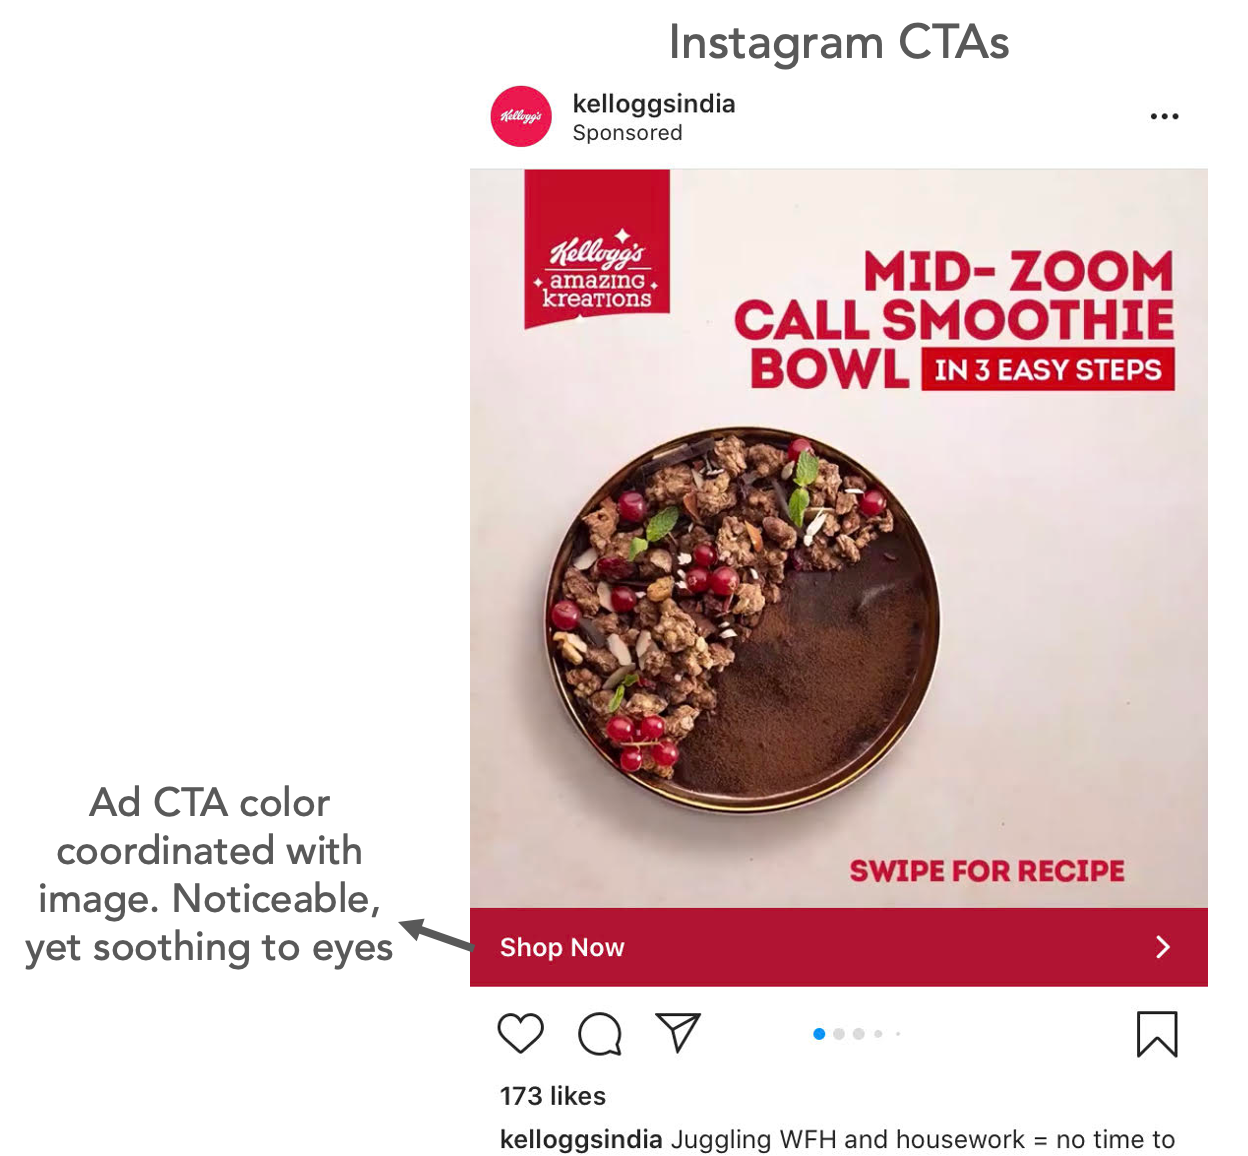
A "good" metric varies with what the action is and what the market comparables are. So we pitted YouTube Vs Instagram, two user-generated-content products to have a rational discussion.
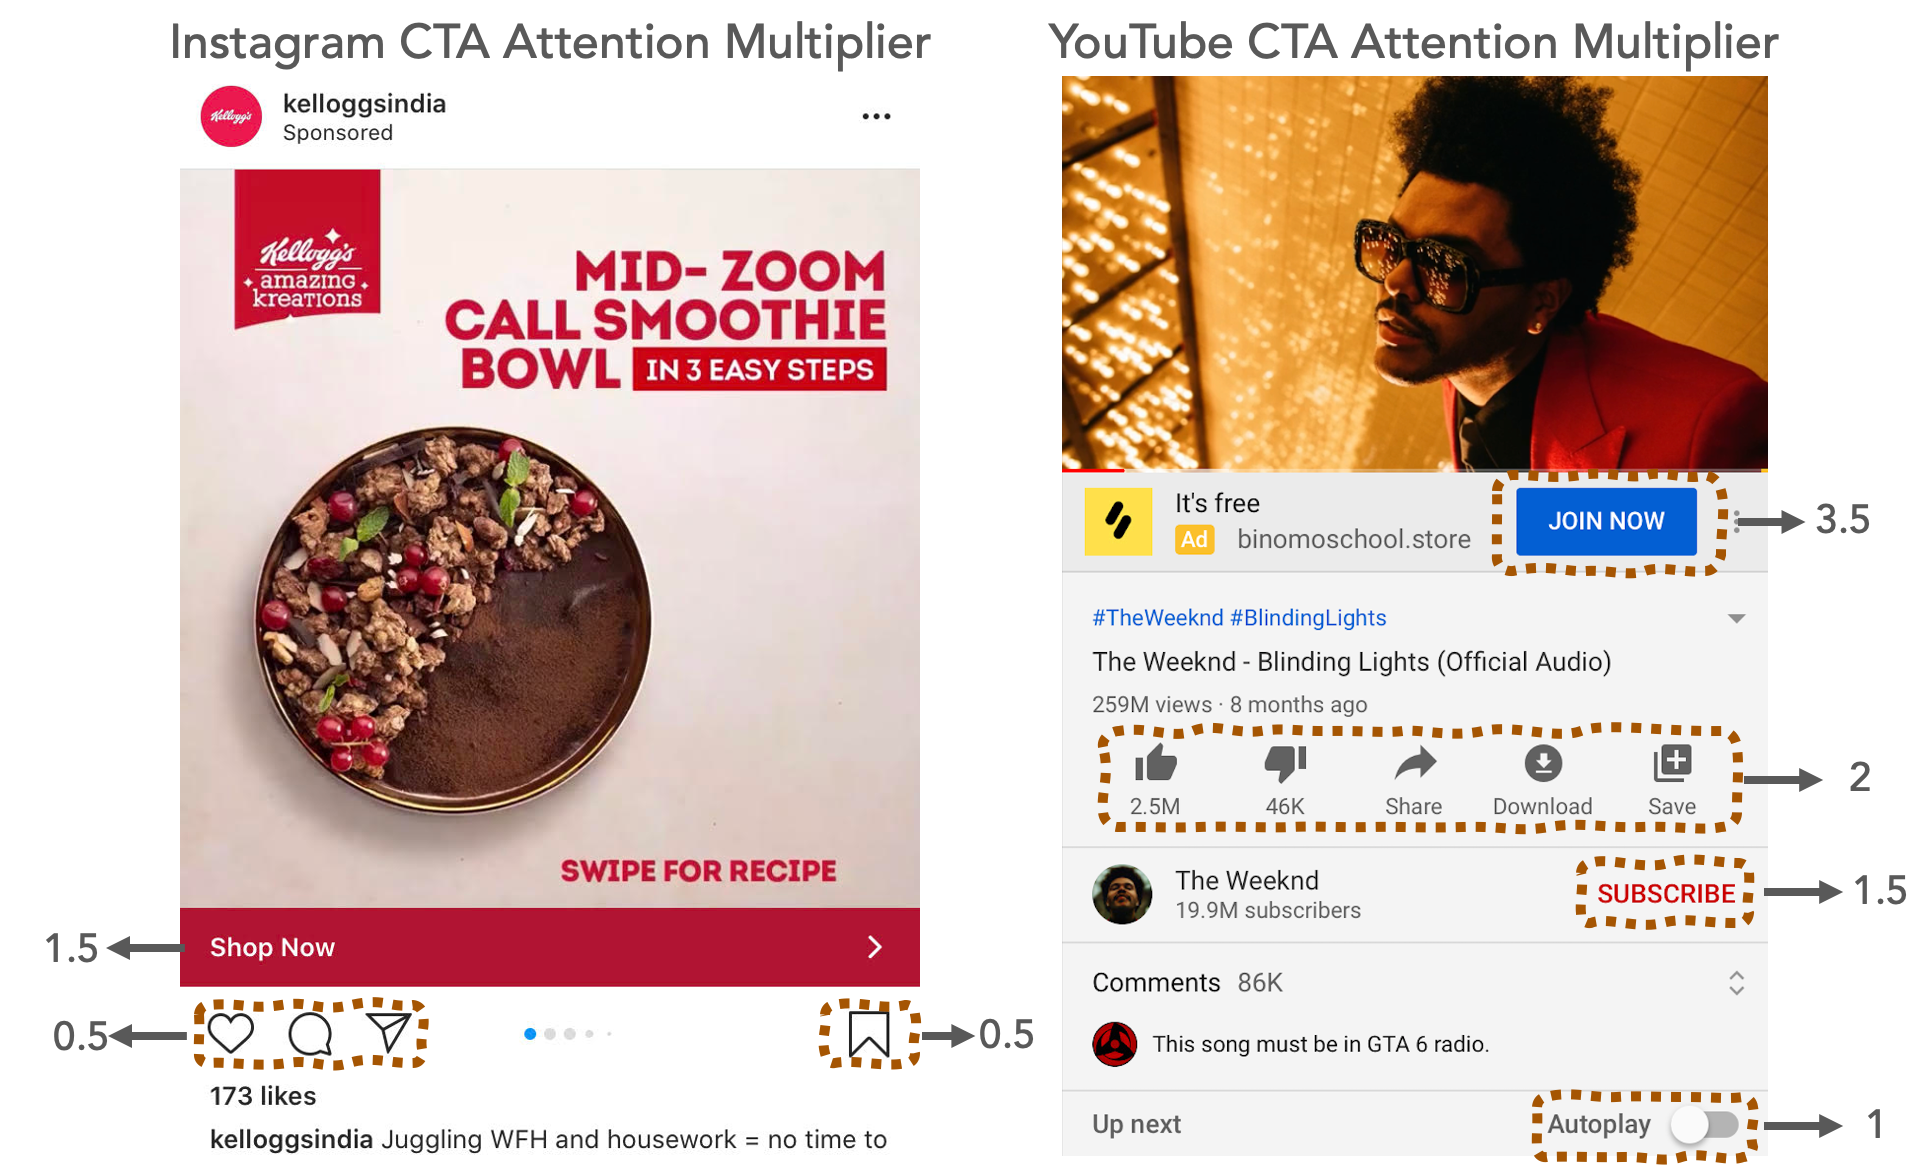

YouTube has “like” CTA—a thumbs up—on every video. [Like + Count] which is about 9,000 pixels is one tappable solid filled CTA. Noticeable and indulging to our eye.
Similarly, Instagram has a "like" CTA—a heart—on every post. [Heart] an outline icon which is about 5,200 pixels is minimal and mellowed to our eyes in comparison to YouTube's "like".
The screen of my phone has about 1 million pixels.
YouTube
Brag Score = [% of screen real estate utilised by CTA X 100] X [Attention Multiplier]
[% of screen real estate utilised by CTA] = 9,000 pixels / 1Mn pixels is ~ 1% of the screen. In other words, ‘Like’ CTA of YouTube takes ~ 1% of screen space.
[Attention Multiplier] = The design of ‘Like’ CTA is noticeable—it's a solid fill icon, add like count it increases the load on the user. Our eye is drawn to it. As CTA goes, it is indulging.
I'm going to go with an Attention Multiplier of 2
So the Brag Score of YouTube’s like CTA = [0.89%X100] * [2] = 1.79
Brag Score = [% of screen real estate utilised by CTA X 100] X [Attention Multiplier]
[% of screen real estate utilised by CTA] = 5,200 pixels / 1Mn pixels is 0.6% of the screen. In other words, ‘Like’ CTA of Instagram takes 0.6% of screen space.
[Attention Multiplier] = The design of Heart CTA is minimal and mellowed—it's a thin, simple outline stroke in black. Our eye is not drawn to it because there's a much bigger full-colour image above it. As CTA goes, this feels less noticeable than the comparable “like” CTAs that we see on YouTube and other social media apps.
I'm going to go with an Attention Multiplier of 0.5.
So the Brag Score of Instagram's like CTA = [0.6%X100] * [0.5] = 0.26
This is extremely low, 7 times lower than YouTube. Nice work Instagram!
Now try doing napkin math for Ad CTAs
In summary
Similar to conversion rate, a standalone Brag Score doesn’t tell us whether it’s good or bad (unless it’s incredibly high). Comparison of the score amongst comparables is useful for decision making and deciding on the trade-offs.
With conversion rate, quantifying users who get little or no benefit from the CTA, and Brag Score in our armoury, we can engage in rational conversations.
Some conversations in action:
👩💼: We need more people to try this feature. In our A/B tests by using this new button style on each post, X metric is up by 15%!
🧑💼: Yes, but it also had a 500% lift on Brag Score. This doesn't seem like a good tradeoff. Can we re-think the button style?
Thank You, Saurabh Das, for the feedback.
In closing
Hopefully, you have enjoyed this post. If you have any additional insights or feedback to share, don’t hesitate to DM me on Twitter & Linkedin.
If you’re finding this newsletter valuable, consider sharing it with friends, or subscribing if you aren’t already.👇
You can always read everything on the website at vishwanath.substack.com
Sincerely,
Vishwanath 👋